Three integrated capabilities, one intelligence system
ForestCast connects monitoring, forecasting, and scenario modeling into a unified platform built for operational decisions at every scale -- from individual counties to the full CONUS.
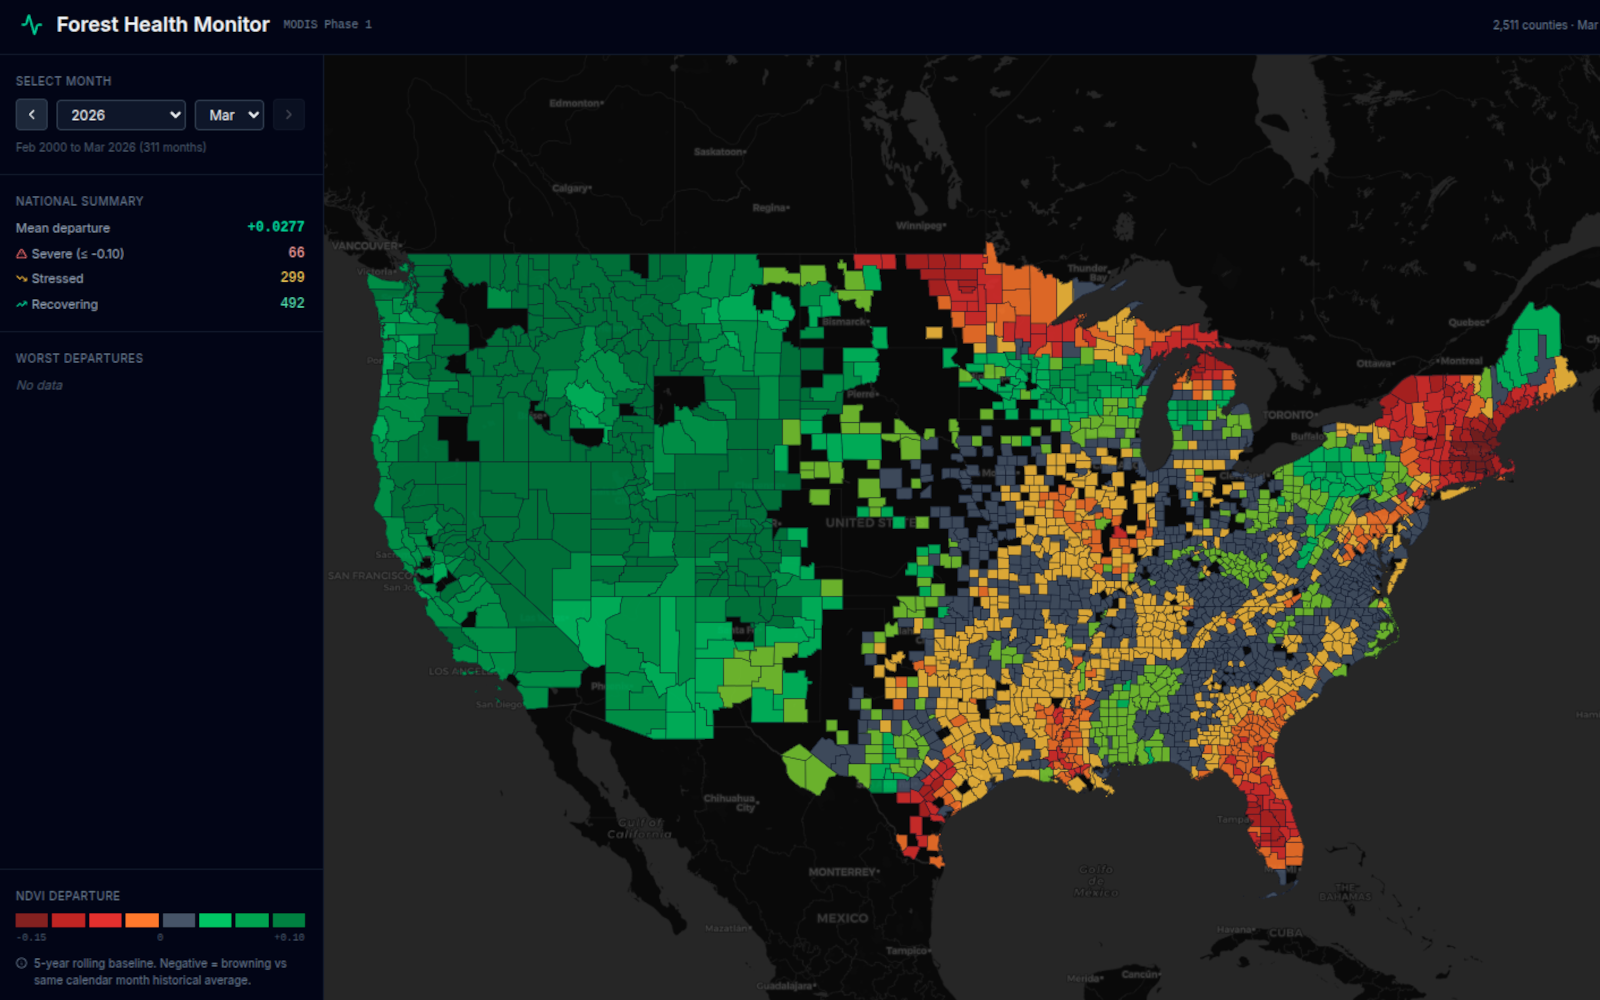
Monitor
While others show you what you can see, ForestCast shows you what you don't.
Forest condition is a physiological state, not a photograph. By the time canopy decline is visible from space, the stress trajectory driving it has been unfolding for seasons or years. ForestCast Monitor infers the hidden physiological state of every stand from the observable signals that escape it.
We fuse optical imagery, radar backscatter, climate reanalysis, and ground-truth inventory into a continuous estimate of stress accumulation, reserve depletion, and structural change. The result is a diagnostic layer beneath the visible canopy that reveals which stands are quietly losing ground long before the loss becomes self-evident.
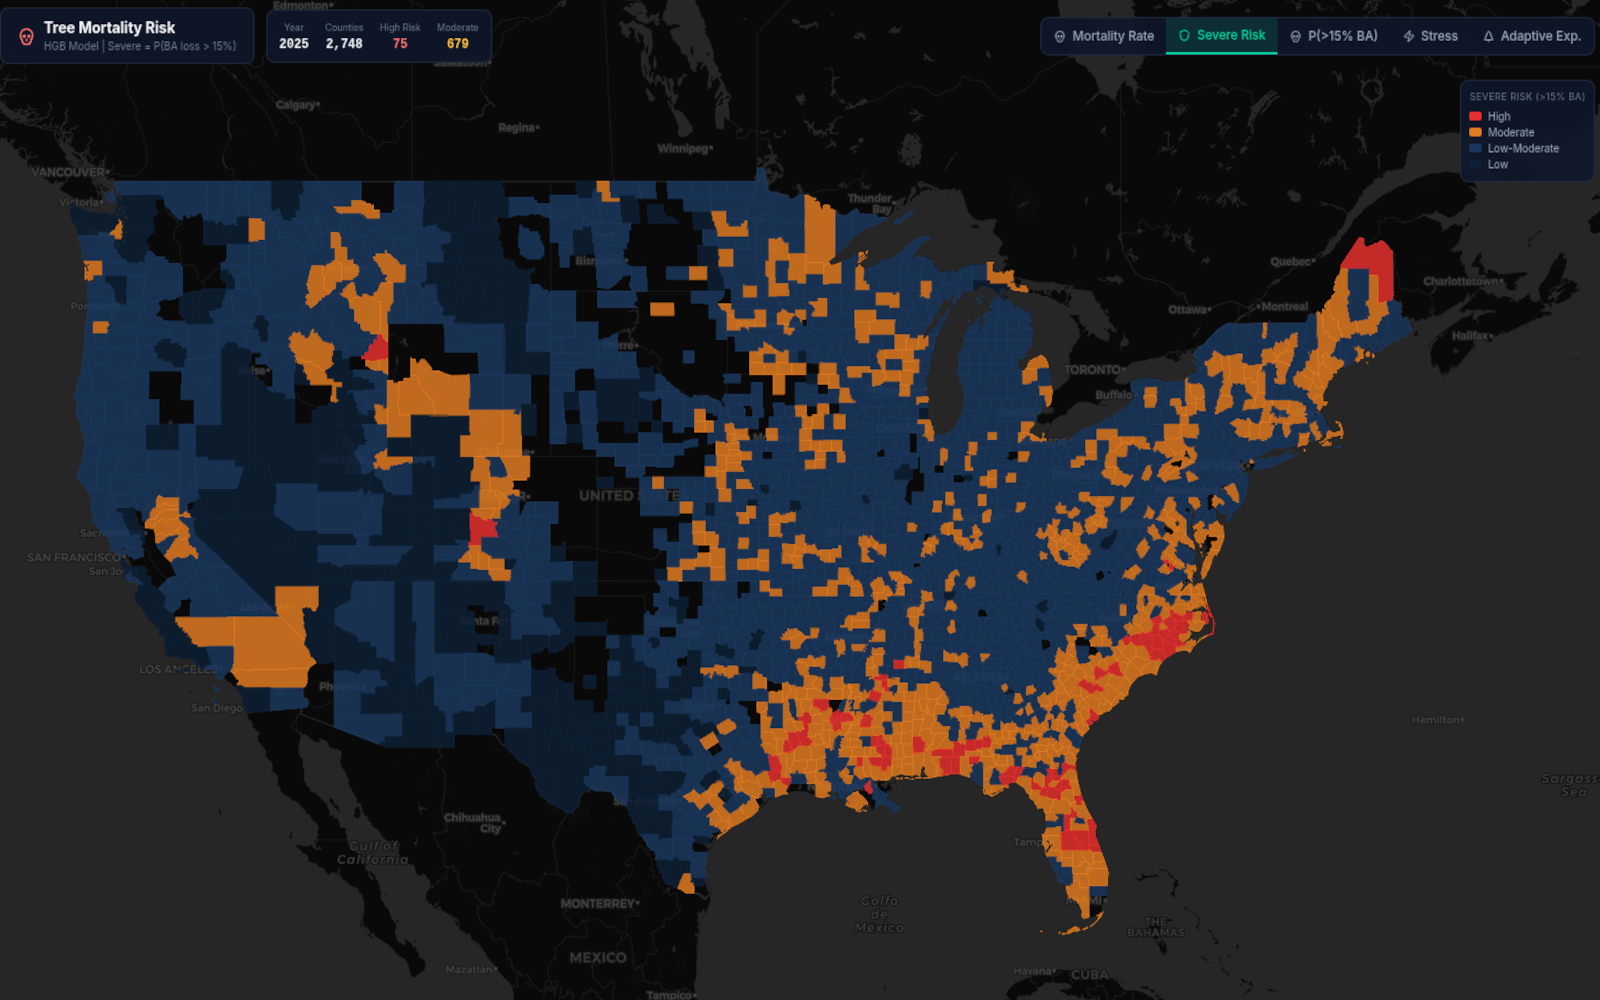
Forecast
While others forecast one threat at a time, ForestCast forecasts the forest.
ForestCast Forecast projects the probabilistic trajectory of every forested landscape across the full spectrum of biotic and abiotic threats -- bark beetles and defoliators, pathogens and fungi, drought and heat, hurricane and derecho wind, ice loading, and wildfire -- over multi-year prognostic horizons.
Where traditional models forecast single hazards in isolation, ForestCast treats forest mortality as the emergent outcome of interacting pressures. A drought-weakened stand becomes an opportunity for bark beetles. A hurricane-damaged stand faces elevated wildfire and secondary mortality risk. Our models capture these cascading dynamics across three distinct mortality regimes: acute mechanical failure, chronic stress depletion, and cascading post-disturbance collapse.
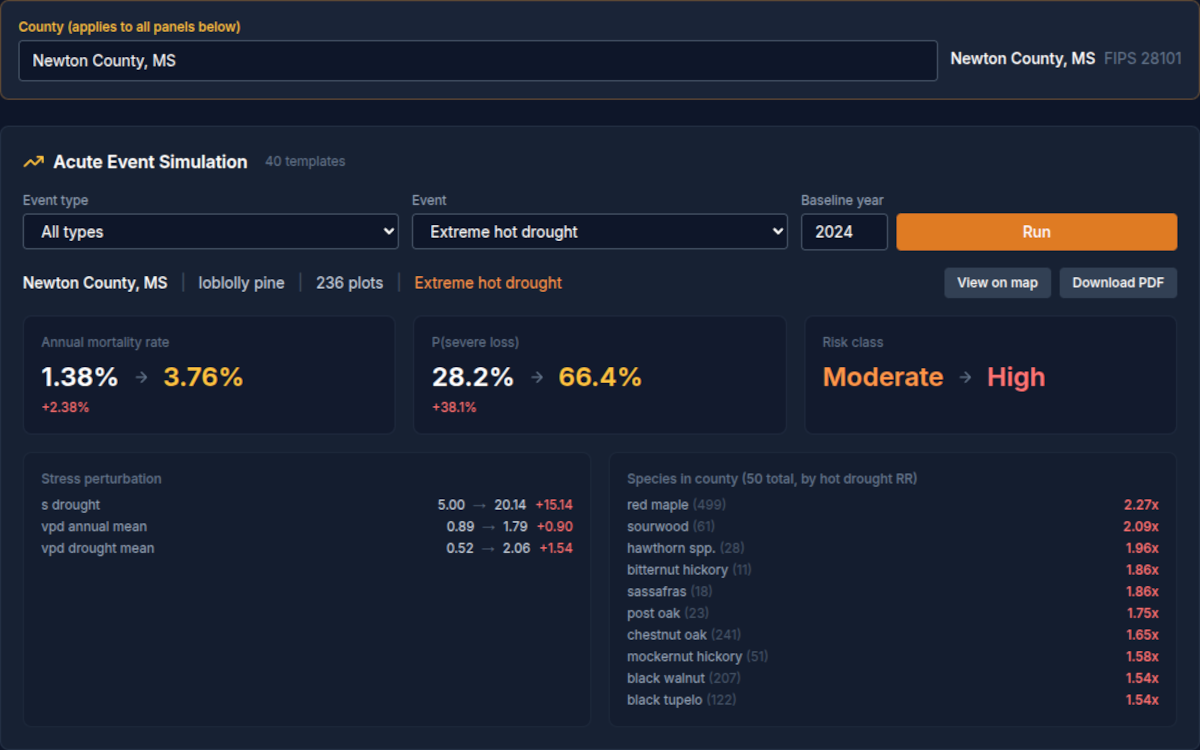
Scenario Engine
Plan for uncertainty. Act with confidence.
Every forest decision is a bet on an uncertain future. ForestCast Scenario Engine lets you understand your choices before you act, and act with confidence when the time comes.
Thin now or wait? Salvage or let it recover? Monitor here or there? The Scenario Engine turns what-if questions into answers you can defend -- comparing alternative strategies side by side and surfacing the decisions where the stakes, and the uncertainty, are highest.
One platform. Three ways to put it to work.
ForestCast meets each kind of user where they already work. Federal scientists and analysts want a live system to explore. Portfolio managers and underwriters want defensible reports they can put in a file. Engineering teams want machine-readable feeds that drop into their own pipelines. The same platform powers all three.
For analysts and researchers
Federal and state agencies, academic researchers, and consulting foresters use the live ForestCast platform to explore conditions, run custom scenarios, and integrate with their own analytical workflows. Continuous monitoring, forecasting, and scenario modeling at every scale, accessible from the browser.
For decision-makers
Timber owners, TIMOs, insurance underwriters, and carbon project developers receive ForestCast risk reports formatted for boards, auditors, investment committees, and reinsurers. Mortality forecasts, stress trajectories, salvage urgency, concentration analysis, and carbon permanence risk. Annual portfolio reviews, one-time assessments, or rapid post-event analysis after a derecho, hurricane, ice storm, or major outbreak. Cadence and scope shaped to your decision cycle. The platform does the work; the report does the talking.
For engineering teams
Organizations running their own actuarial, GIS, or forest management systems can pull ForestCast risk scores and forecasts directly via REST API, GeoJSON, and CSV exports. Automated data refresh keeps downstream pipelines current.
Built for integration. ForestCast is engineered around API-first delivery and automated data refresh, with outputs designed to drop into existing actuarial, GIS, and forest management workflows. The same data that drives the dashboards is available programmatically for partners running their own analytic pipelines.
Ready to talk?
Reach out to discuss collaboration, pilots, or how ForestCast can support your work.